|
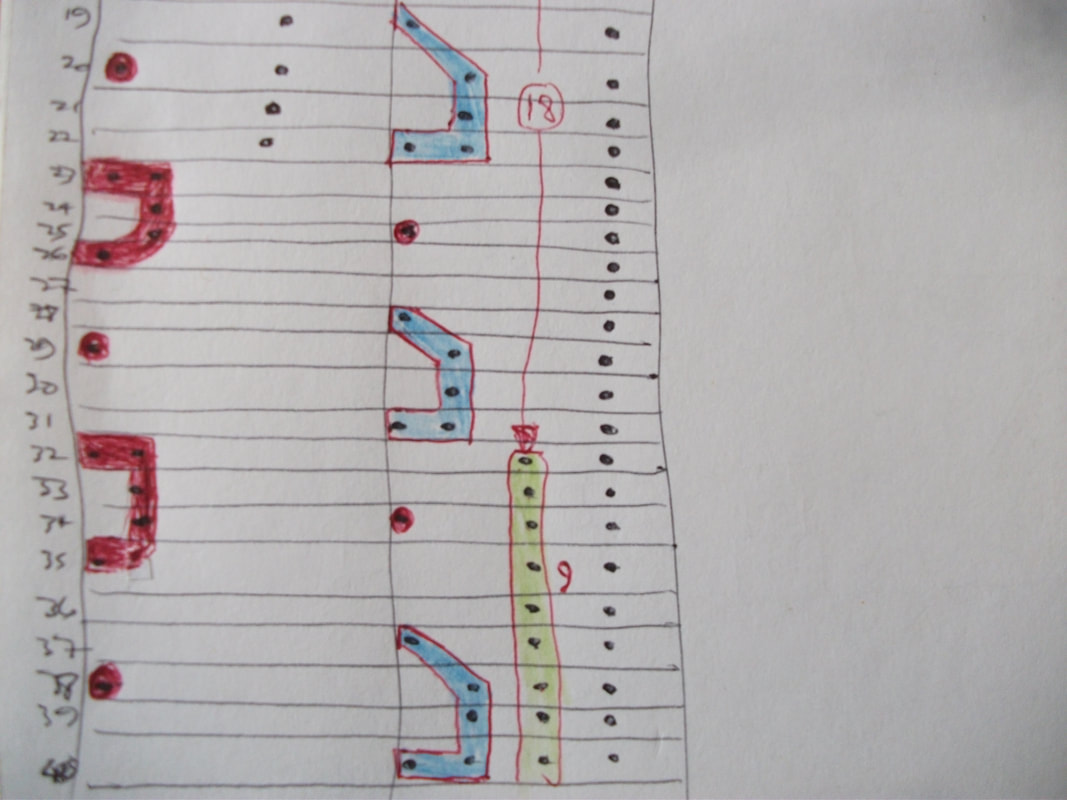
At last I can put one of my Common Gull Count graphs on here. My "new" but crap camera still won't "do" close-ups so I've spent several weeks trying to persuade The Significant Otter to photograph one of them with her fancy-pants I-Pad.... and eventually, she has . Reluctantly. She has suggested that I should get my own .... but I'm not going to spend 300 quid on something we've already got. Anyhow, there it is ... with the first 8 counts. It's a plot of the number of Common Gulls against the Total Flock Size. 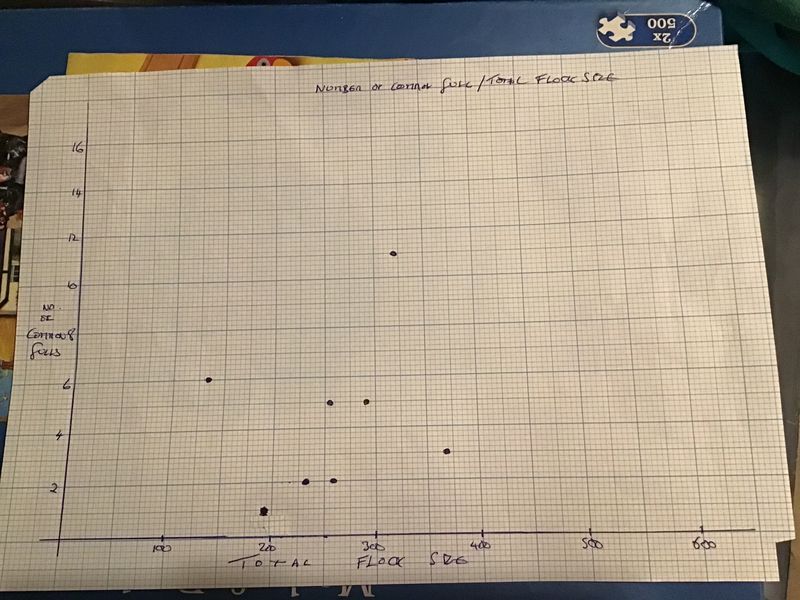 It's early days yet,, and it is a bit diffuse, but already there's a reasonable correlation between the two variables. There's two "outliers" to the right and left, but the rest of the dots show a strong link between Flock Size and CG numbers. So, let's compare it to a previous. more complete CG/Flock size graph .. Here it is ... as of Jan 19th 2019 .there's definitely a diffuse "trend" from lower left to upper right..... 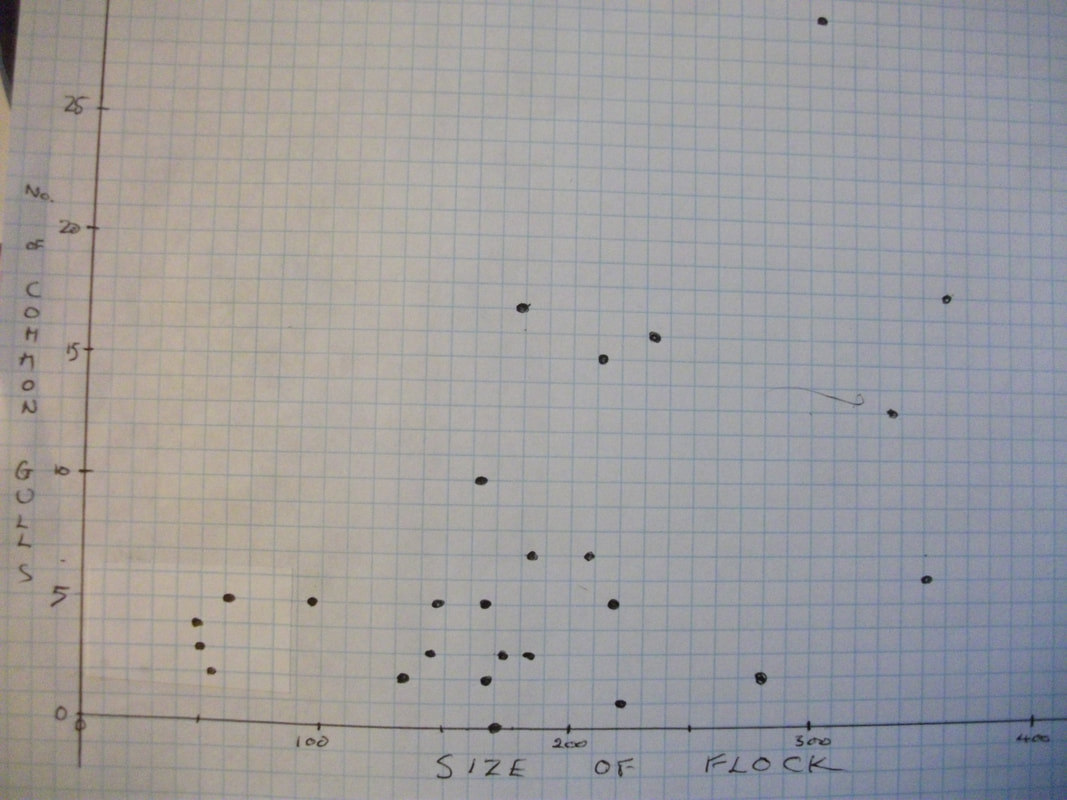 When I started doing those counts, I wondered why there was a correlation .. albeit not a brilliantly precise one ... between the two variables. Especially as the Common Gulls are strictly limited in both timing ( winter only) and numbers ( fairly low and fixed once they've arrived). The obvious question is ... where are the "other" Common Gulls when they aren't at my chosen spot ? Presumably with some "other" mixed flock somewhere else. So ... we've got off to an interesting start .... ... and it keeps me out of mischief..... ... so let's celebrate with a spot of fine music .... filmed on Bangor Pier ... just a few yards away from the pub in which I met The ( Eventual) Significant Otter ... it's strange how things turn out ......
0 Comments
Leave a Reply. |
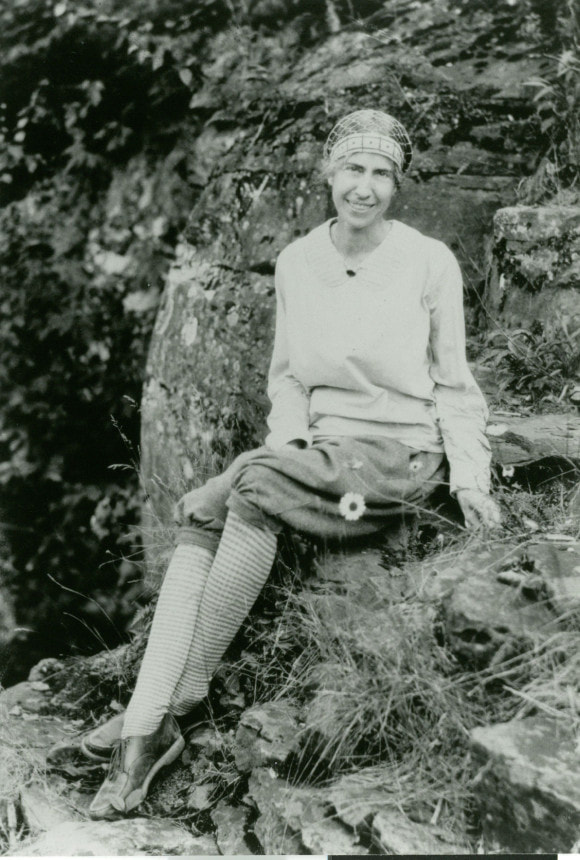
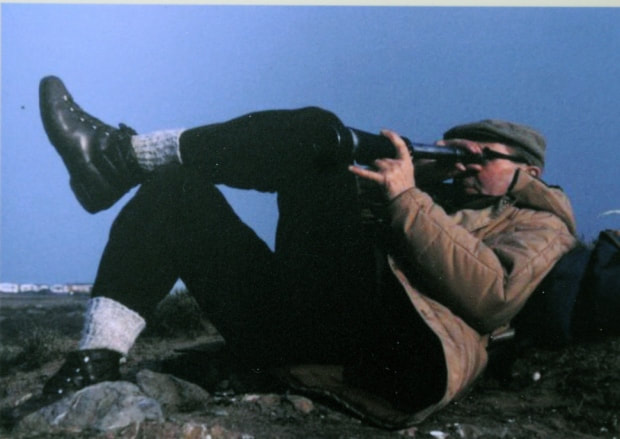
AuthorThat's the author up there ... I was young and sprightly then. Archives
October 2022
|
 RSS Feed