 I've made another graph using the same data as I had in the previous post ( see previous post) ..this time, I've plotted the % of common Gulls in the flocks over the few weeks we've had so far .... ...here it is ... in all its wonder ... WOW .... to the untrained eye, you would be thinking, whoosh goes the population. ! Blimey ... before we know it, Flintshire will be buried under a 30m heap of Common Gulls. How will we get to the shops ? 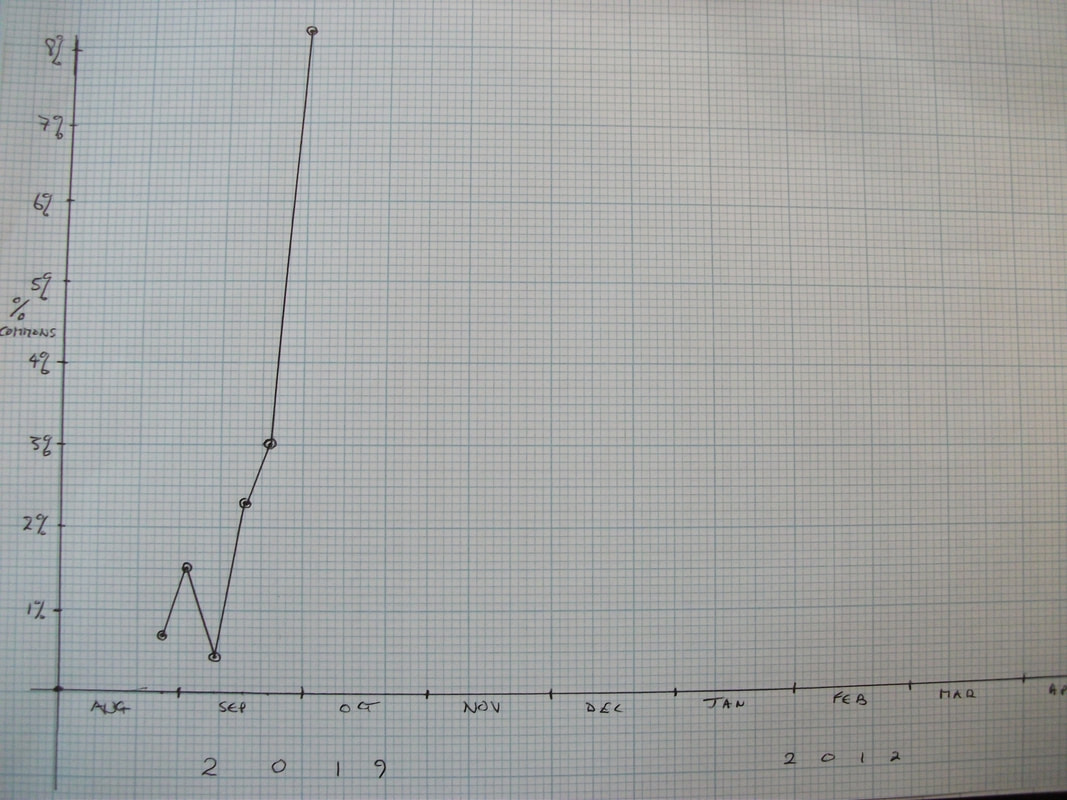 But, of course, these aren't a picture of how many gulls there are ... it's how many there are relative to the total number of all the different sorts. It just shows how you need to have a good look at those "bits" around the "sides" of a graph ( sorry about the technical terms) before you jump to any wild conclusions. And the bottom line is, that graph doesn't give you any idea at all of how many Common Gulls there actually were. Oh, the calumny ! Let's look back to the original, "actual numbers" graph I put on here last time ... 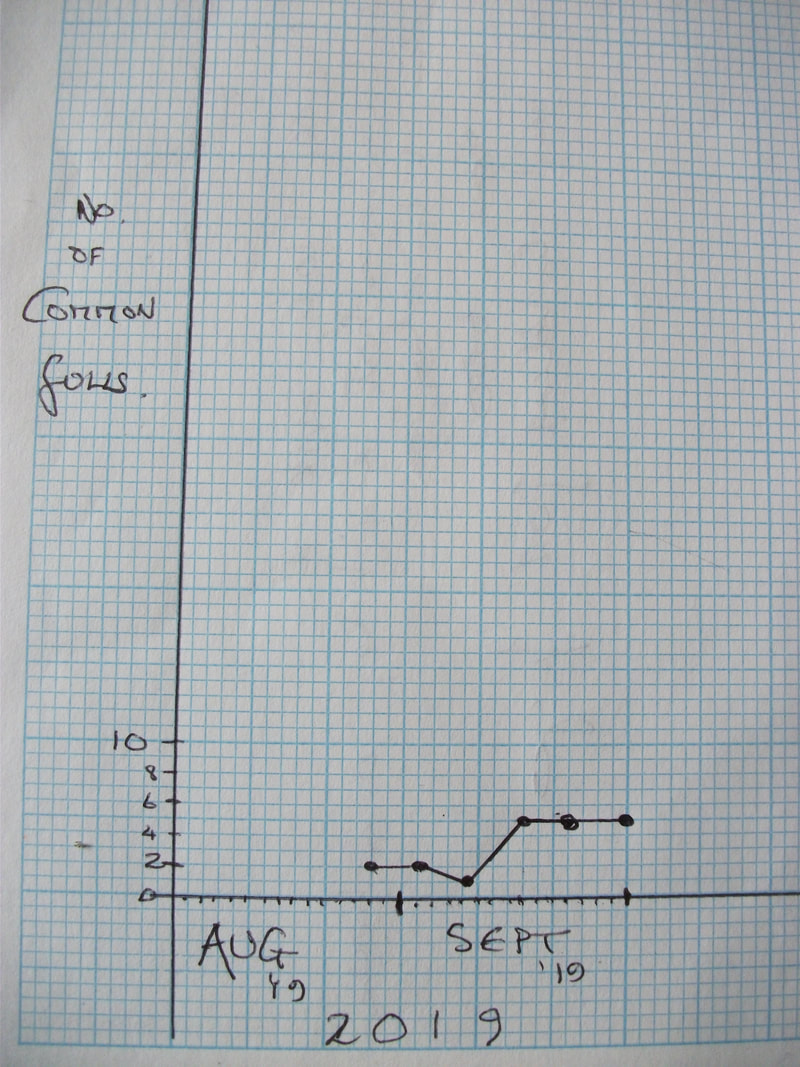 Phew ! What a relief ! We'll be able to get to the shops after all. Naturally, I'll be doing other ones as well ....and continuing those ones. Well, it's raining now, and it has indeed been raining for days. What we need now is a belter of a song to crank up our well-being quotient. And yes, I know this has been on here before, as have I, but it's just what we need in such Biblical times.
0 Comments
Leave a Reply. |

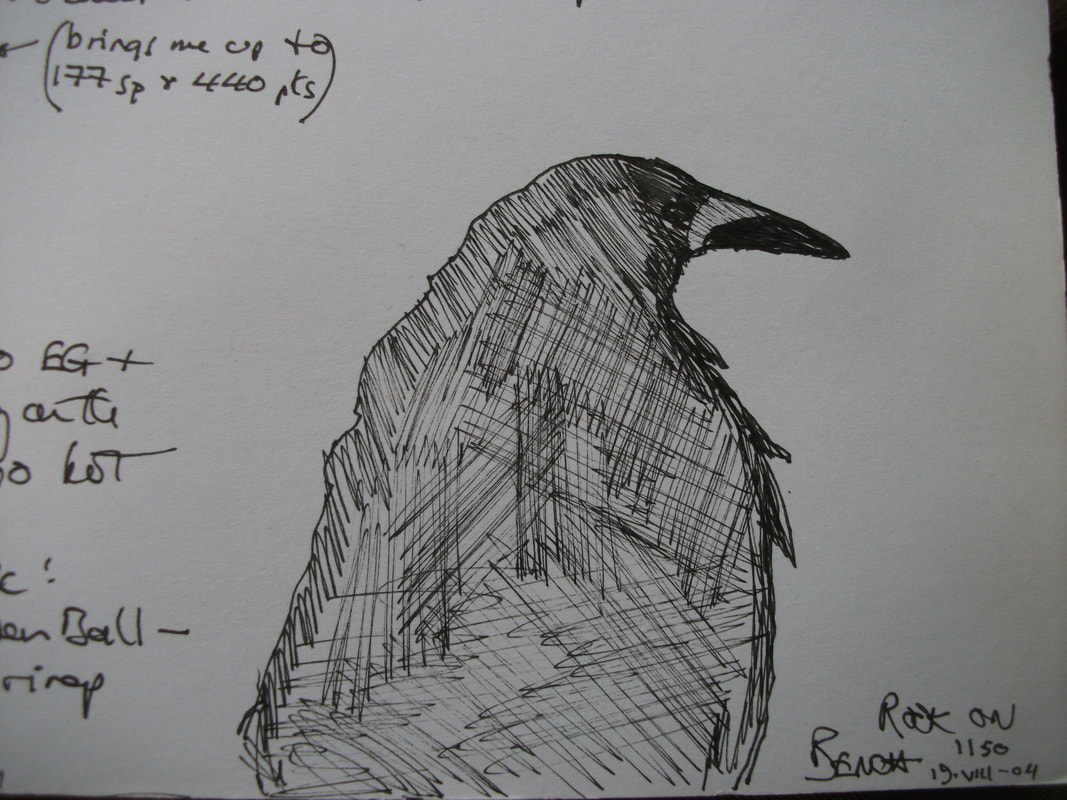
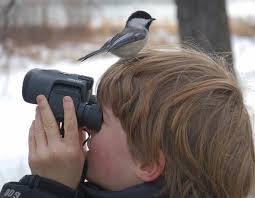
AuthorThat's the author up there ... I was young and sprightly then. Archives
October 2022
|
 RSS Feed