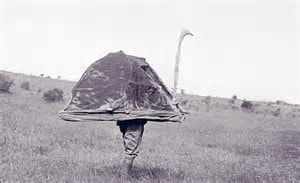
 I bet you never thought that graphs could be dangerous ! Remember my harrowing account of the unusually low Common Gull counts on my local river last winter ? The thing was, I didn't bother keeping track of the numbers because I though they would improve ... but they didn't. Over the whole winter period, compared to previous years, numbers were low. So, this year, I have been counting ..and here's a graph of the percentage of Common Gulls in the flock .... well, the first two results anyway. 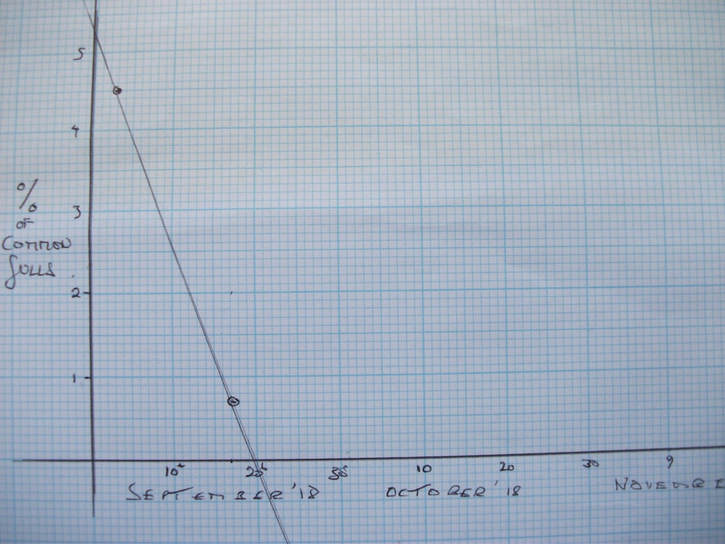 As you can see, there has already been a drastic decline ! Eek, !! And it looks as though my next count is almost certainly going to be less than zero %. Ouch ! It's especially "ouchy" because you can't actually get a negative percentage of birds. Let's take a more sensible approach shall we ... because simply assuming a straight-line relationship isn't working .... Let's try a nice smooth curve ... mathematicians like them ... 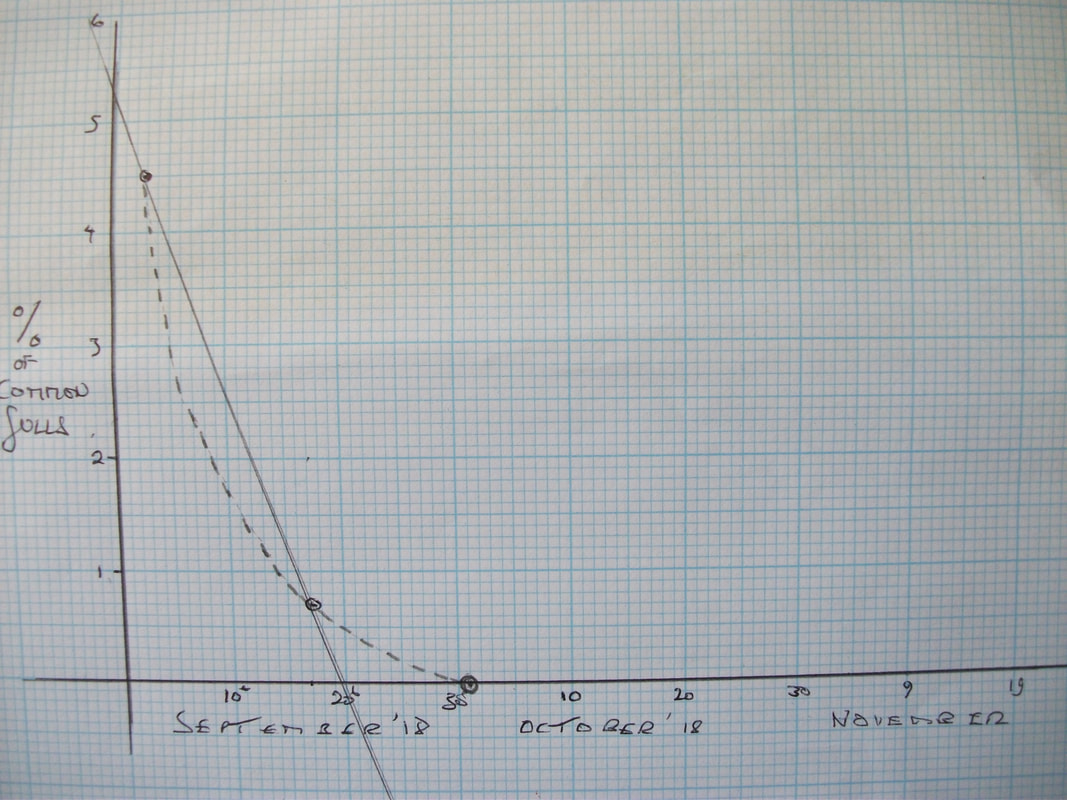 The curve , which now includes the 3rd count ( 0% Common Gulls) on 1st Oct, at least gives us a somewhat less ridiculous picture. But if we continue that slope, it still predicts a rather foolish negative percentage again. 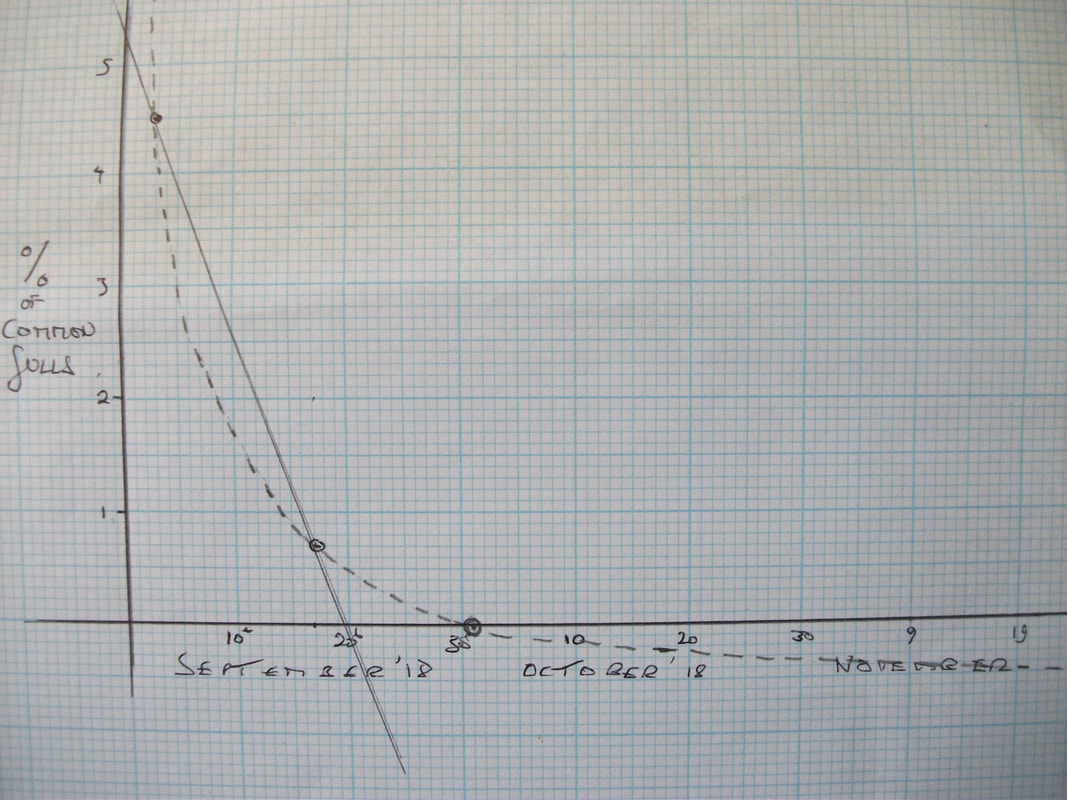 Let's do a different thing entirely ..... let's have a nice symmetrical curve ... like this .... rather clumsily inked in by, er, me. 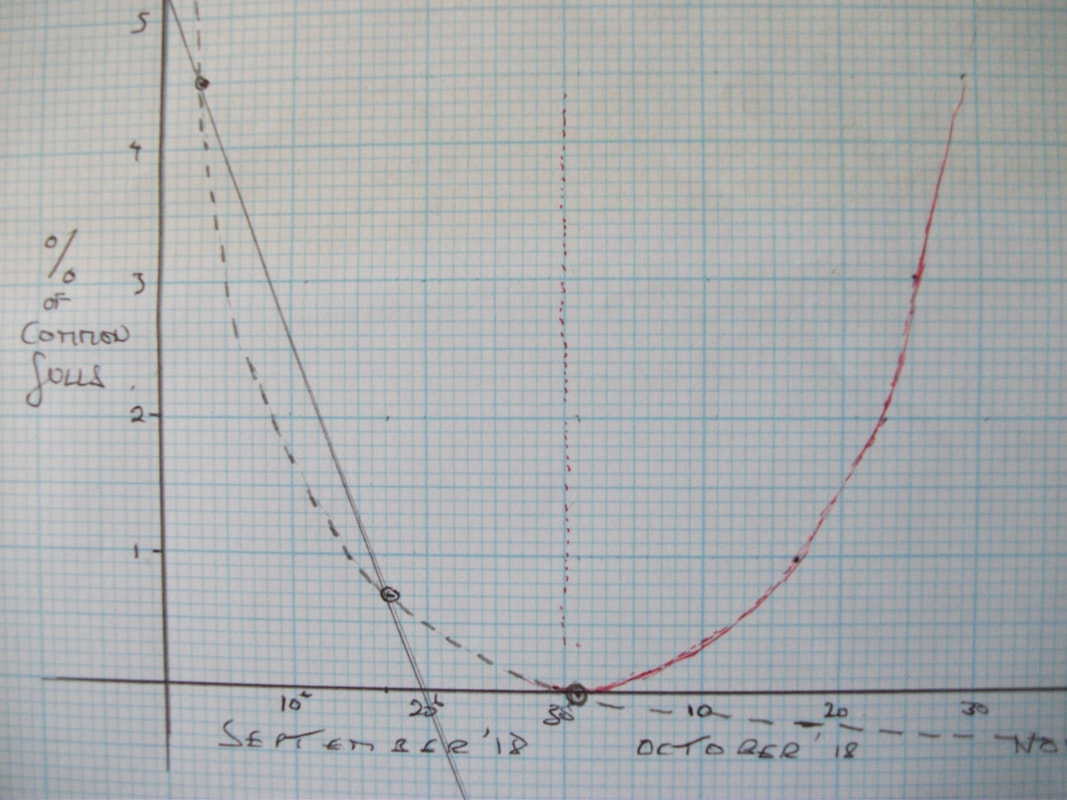 Well, it's neat and (almost) symmetrical, but now it's predicting exponential growth ... from a zero base ! At least it isn't impossible ... but it's hardly realistic. So what do you think the "true" graph over the whole winter season might look like ? What are the Common Gull percentages far more likely to do ? Here's those same three data points with a very different, more realistic "future." And there's a more-or-less infinite number of other fluctuating interpretations of the same set of dots. 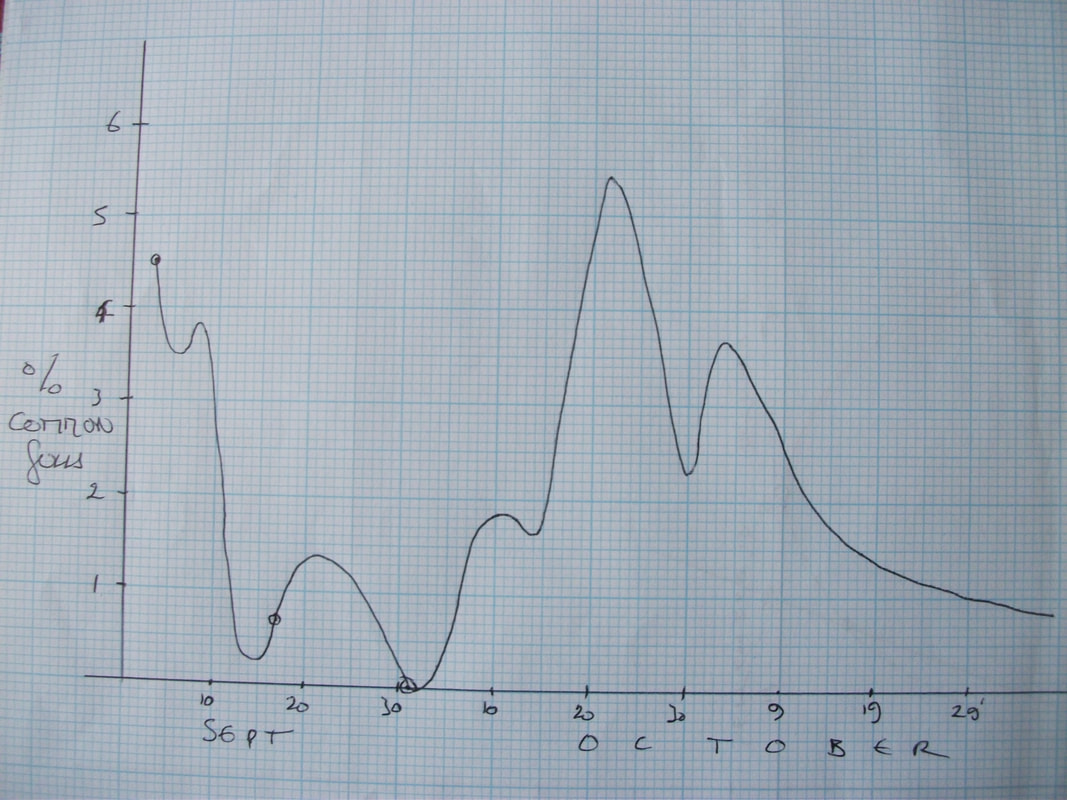 Yes, the obvious truth is that numbers will fluctuate in an unpredictable way ... certainly in the "middle" of the winter ... obviously at the start and finish of the season numbers will rise as the first arrivals come in. ... and then tail away as they leave. But in between ... who knows ? And the point about all this, really, is that you can't always go using your school-based bog-standard linear graph to describe this sort of system .... nor, for that matter, that third type ... a sort of neat parabola-type plot. Or a whole tranch of other equation-based plots. The "media" are very prone to that sort of thing .... drawing a graph like those first four up there for a potentially unpredictable scenario .... and then happily extending the plot to predict the future situation. And then basing the country's economy on those predictions, or climate change, or oil supplies, or GDP, or population growth, or the price of beer. Or, of course, bird populations, mortality rates, river flows, next winter's weather, arrivals of migratory birds .... the mistakes are all there just waiting to be made ! In some ways, in some situations, thoughtlessly extrapolating a graph can be misleading/dangerous. And on top of all that, there's a whole massive flaw in all of those graphs I've drawn ... something I really ought to have done ... but haven't. So, dear reader, what should I have done ? It's something I've criticised on here before. It's something you will see all the time in the media. I don't think there's all that many songs about graphs so first I'll show you this short video which shows some ways that graphs can be misleading .... ..and now we'll have the music ... DCFC ... Little Wanderer ... with the words. I hope you're still thinking about what those graphs weren't telling you .... I'll let you know after this picture ...  Well ... those graphs were based on the PERCENTAGE of common Gulls in the whole gull flock. So that 1st plotted point .... 4.5 % on Sept 2nd doesn't tell you anything about the actual number of Common Gulls that were present. There could have been 4, or 236 or 1146 ..... don't forget that the % might well have been rounded off. When it comes down to it, why did I compare the Common Gull numbers with the total gull count ... what have the other species got to do with it !? It's the Common Gull numbers that were the important thing. Using a percentage effectively loses one of the most vital bits of information ... the actual Common Gull numbers at each count. There's a whole lot of difference between ,say, numbers dropping from 5000 to 2500 and numbers dropping from 10 to 5 ! But, percentage-wise, they're the same. But the first scenario still leaves you with a hell of a lot of Common Gulls ... but the second one doesn't. So ... beware of "survey results" that only tell you the percentages and not the actual numbers. 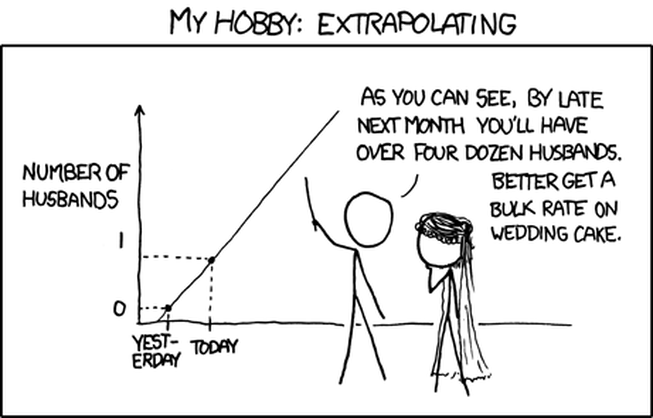
0 Comments
Leave a Reply. |

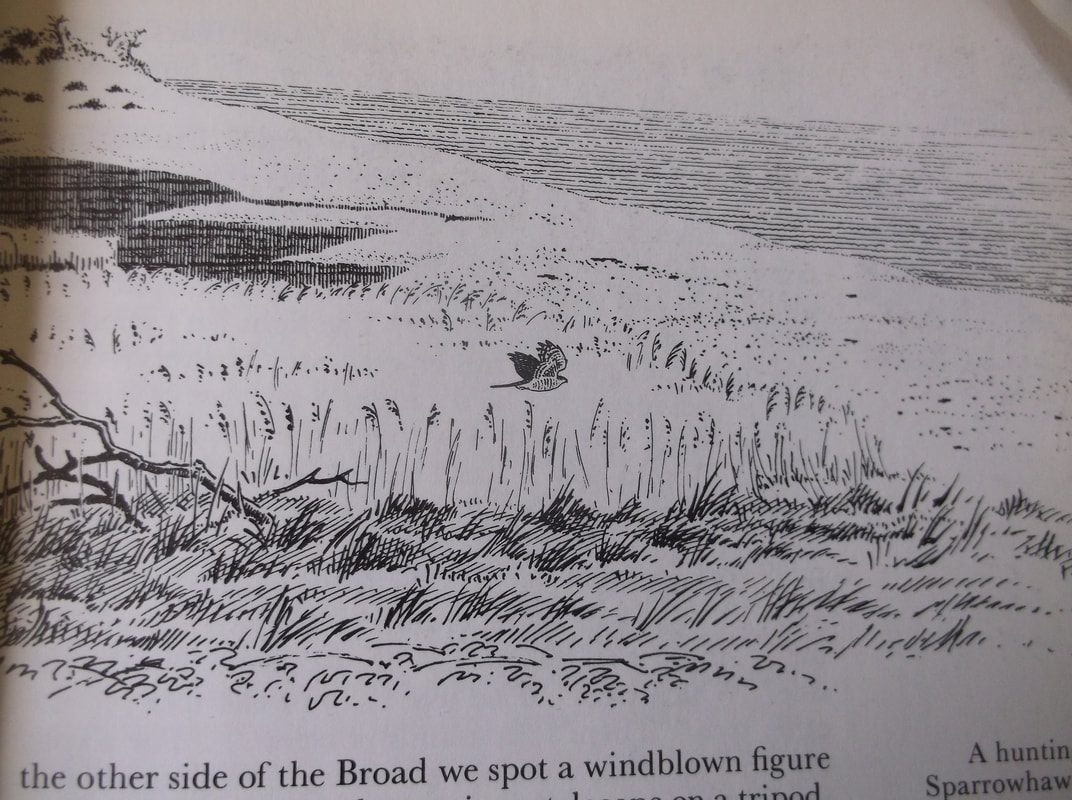
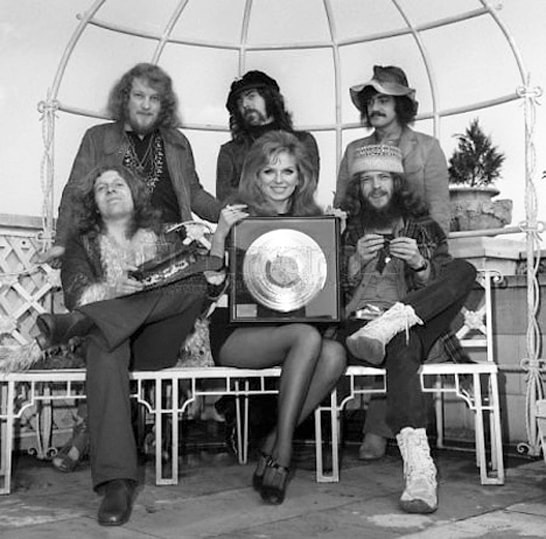
AuthorThat's the author up there ... I was young and sprightly then. Archives
October 2022
|
 RSS Feed